Case Study: Human Computer Interaction

Autonomous robots are about to transform delivery. These AI-powered machines can navigate streets on their own, promising faster and cleaner deliveries.
The decision
However, ensuring they operate safely and without disrupting pedestrians is crucial. This study will examine the trust in these robots.
Determine how trust in delivery is perceived for autonomous robots and the key challenges to their successful integration. The minimum acceptable trust level is 70%.
My Role:
UX Researcher
Team (3):
3 UX Researchers
Duration:
4 Months
Company:
Tallinn University
Year:
2024

Tim Neumann

Martin Perez

Ryan Birmingham
Research
Designed a pilot study (6 participants). The survey itself was at least adequate to continue with a full survey with these questions.
Design a full survey study (21 participants). Questions were selected from the possible further questions from the pilot study analysis.
Results
Cronbach’s alpha coefficient
Trust Level Reporting Results
Crosstabs:
HCTS with Background and Demographics
Doubts, Fears and Problems
Features to feel more comfortable
Methodological Overview
The Objects of Evaluation:
Apparatus and Materials: Mobile app or a desktop/laptop
Tools and Methods:
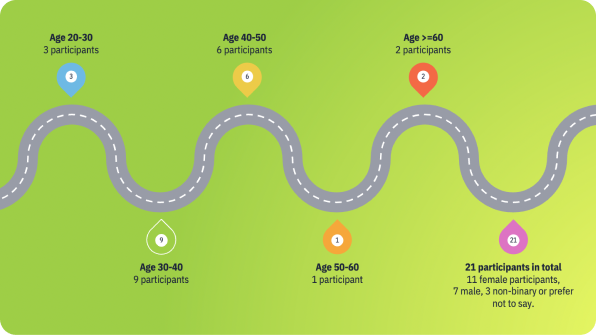
Participants: 21 Participants, 18-65 yrs.
Active users of various delivery services (e.g., food, medicine, package signing) to holistically represent the delivery space.

Richard

Jorge

Sayuri
+18

Trust Level Reporting Results
Cronbach’s alpha coefficient is 0.73
According to Pallant (2013), a Cronbach’s alpha value above 0.7 is necessary to ensure
the reliability of the study’s measurements. In our study, the HCTS scale achieved a value of 0.73, indicating good internal consistency and reliability for measuring trust.
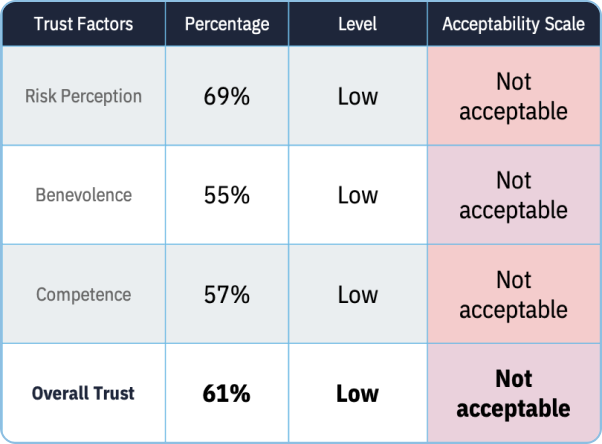
Our findings show low trust levels at 61%, with no trust factors meeting the acceptability scale. With more participants, marginal acceptance in overall trust is possible.
Participants aged 20 to 40 showed higher trust in ADRs (average trust > 3.0/5) compared to those aged
50 to 60 (average trust 2.5-2.6/5).
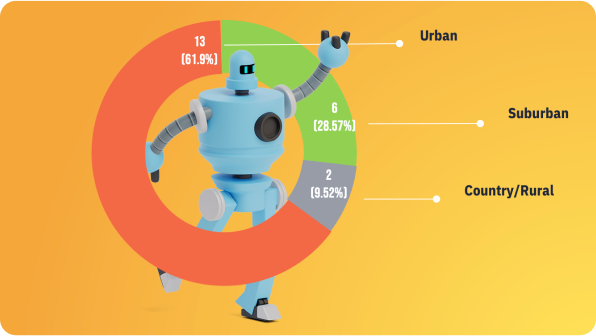
People living in urban areas
(average trust 3.19/5) expressed
greater trust in ADRs compared
to those in other regions (average
trust 2.61-2.79/5).
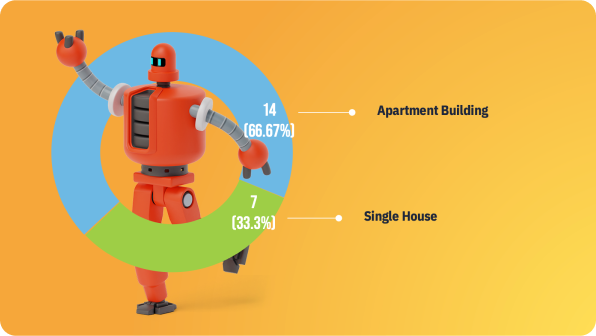
People living in apartment building (average trust 3.16/5) expressed greater trust in ADRs compared to people living in a single house (average trust 2.74/5).
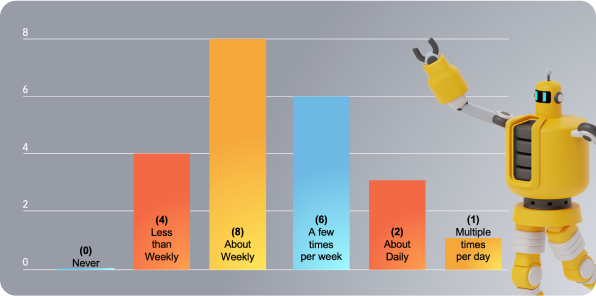
Participants who used delivery services weekly or a few times per week (14/21 participants) had almost marginal trust (3.15/5).
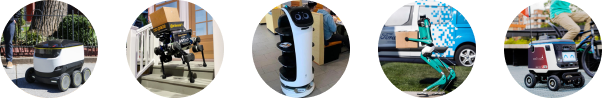
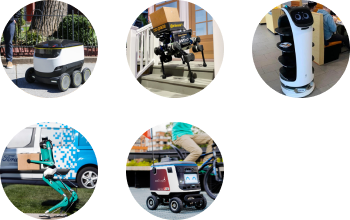
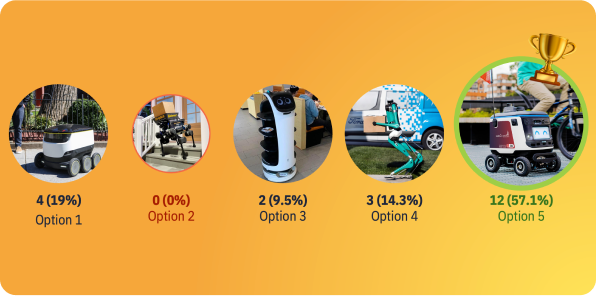
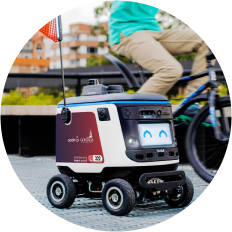
Half of the participants (12/21)
preferred robot option 5,
their trust in ARDS (3.06/5)
was lower compared to
those who preferred robots 3
and 4 (average trust
3.29-3.55/5).
Trust in option 1 was the
lowest (2.44/5). Robot option
2 wasnot selected by anyone.
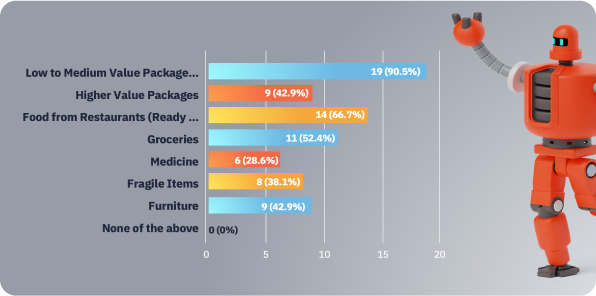
Grocery and restaurant
deliveries are more frequent
(52.4% and 66.7%).
Medicine and fragile items
are less common (28.9% and
38.1%).
90.5% order low to medium
value packages (under 100
USD/EUR, 300 SOL).
42.9% order furniture and
high-value packages.
Robot 5
Doubts and Fears
They majority of users are:
Most of them ask:
Mitigations Suggestions

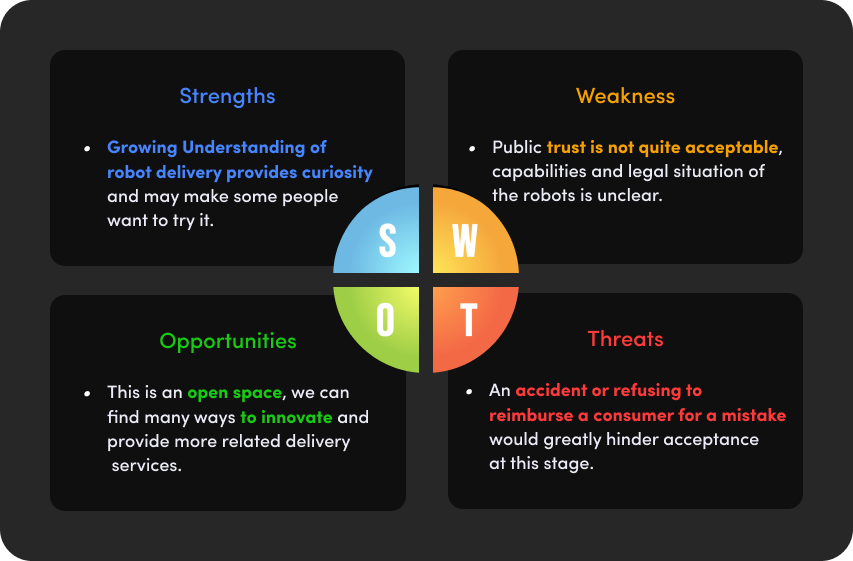
Strengths
Growing Understanding of robot delivery provides curiosity and may make some people want to try it.
Opportunities
This is an open space, we can find many ways to innovate and provide more related delivery
services.
Weakness
Public trust is not quite acceptable, capabilities and legal situation of the robots is unclear.
Threats
An accident or refusing to reimburse a consumer for a mistake would greatly hinder acceptance at this stage.